This post is my version of analysis of OSC lab task 5. The full task sheet can be found here. Check the appendix for source code and output csv files.
Task 5
By running task 5 source code task5.c and visualization code vis.py, we can get visual result of process scheduling.
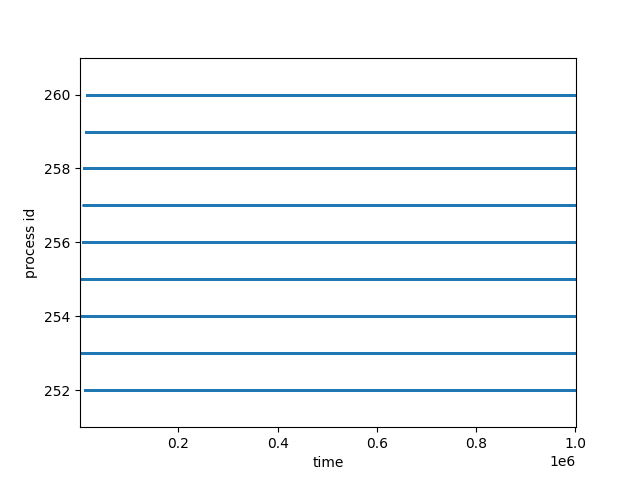
The following result is based on 1 second of experiment duration and 8 processes, output files are named as <pid>.tmp.csv call python script as python vis.py <min_pid> <max_pid> to get the visualization.
Note that using stdout or stdout with redirection may harm the output format, so we write them to files respectively to keep consistency.
We can clearly see that even within one second, all of the processes are scheduled massively and rapidly, making the plotted dots look like lines.
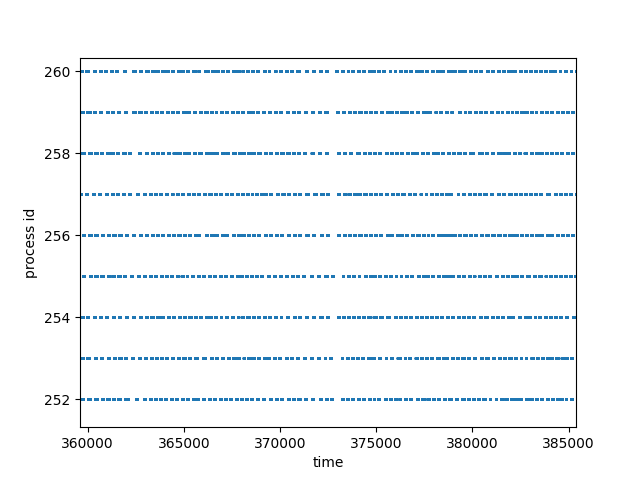
Zoom in the figure, we can find out that these lines are actually composed by dashed lines with various length. This verified that during the running time, processes are scheduled in a time-sharing manner.
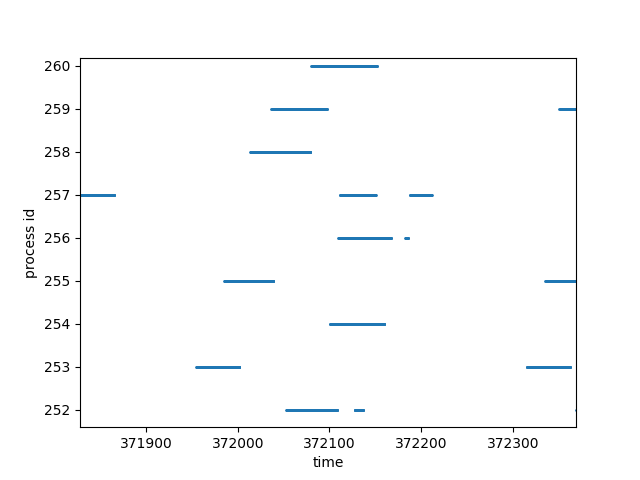
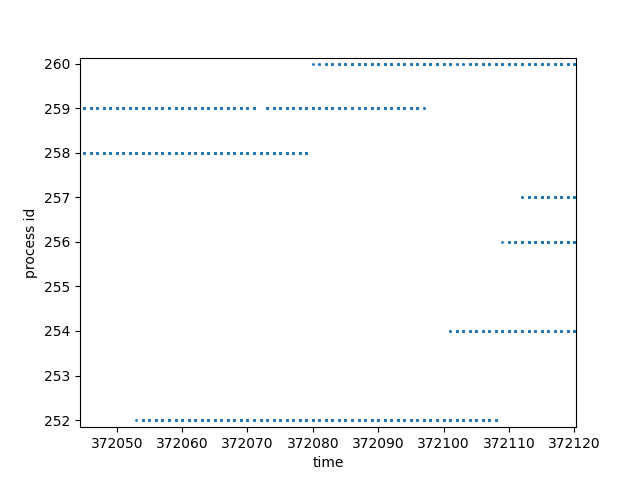
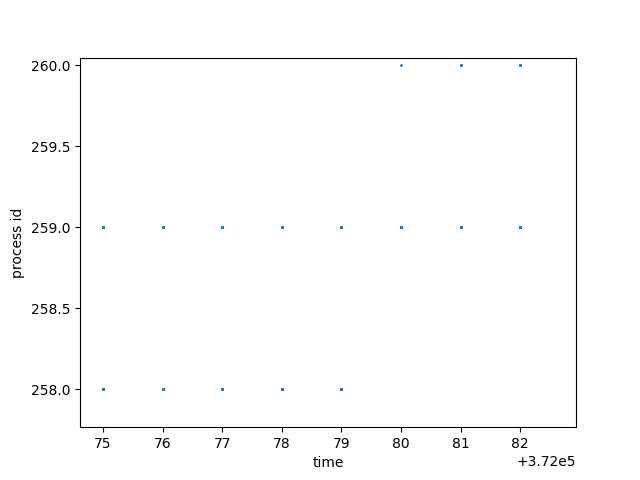
However, things are not so simple as we thought. When we zoom in further, we can see that some dashes have overlaps on their running time, this is what we are expecting because only one process can run at one time. This is because there is more than one CPU core / hardware threads. Actually, take a closer look at the following figure, we can see that at time 372079, the running process was changed from pid 258 to pid 260, while process 259 keeps running throughout the context switch.
For example, we can see that process 259 was scheduled since time 372036, and ran until time 372097, at least 61 microseconds in total.Then it was preempted by process 254 at time 372101. A 4 microseconds of context switch cost is reasonable.
Even though every microsecond there are multiple printed lines, as their printed time is same, they are plotted on the figure as a single dot. (A zip archive of csv used for this analysis, ranging from pid 251 to 260, can be found at the appendix - CSV.) We can simply say that microsecond is still not the best granularity to this experiment, or in other words, modern CPUs are too fast to be measured.
intmain() { // get the base time structtimevalstartTime; gettimeofday(&startTime, NULL);
int i; structtimevalcurrentTime; pid_t pid; for (; i < NUMBER_OF_PROCESSES; i++) { pid = fork(); if (pid < 0) { printf("fork error\n"); } elseif (pid == 0) { break; } } /* IO may be disturbed by context switching, especially with stdout redirecting. Save the output to their own output file respectively, named with their pids. */ char file_name[15]; sprintf(file_name, "%d.tmp.csv", getpid()); FILE *f_ptr = fopen(file_name, "w"); while (true) { gettimeofday(¤tTime, NULL); fprintf( f_ptr, "%ld, %d\n", getDifferenceInMicroSeconds(startTime, currentTime), getpid()); if (exceedDuration(startTime, currentTime)) { fclose(f_ptr); exit(0); } } }
// gcc task5.c -o a.out -Wall // ./a.out
Python
The following python script is used to visualize the result of task 5.